Nowadays the General Data Protection Regulation (GDPR) requires the data scientist to always guard the privacy of the people we study. For this reason this post will show how to make an extended scatterplot. That is we visualize, using clustering in R, only groups of people. As a result the groups that are visualized are of a minimum size as required by regulation and/or the organisation.
First of all install and load the required packages stats for k-means clustering and ggplot for visualization.
if(!(require(stats))) {install.packages("stats"); require(stats)}
if(!(require(ggplot2))) {install.packages("ggplot2"); require(ggplot2)}
Second of all construct a function for re-usability.
PrivacyPlot <- function(plot.data, xval, yval, min.points = 10,
                        n.points = 5, decide.k = F, alpha=1.0, title = "") {
.....
}
Now we add the code to the function. First we cast to a matrix, because kmeans requires the data as a matrix. Secondly, we try different numbers of clusters k such that the number of clusters meeting the required number of points is largest.
data.matrix <- as.matrix(plot.data[,c(xval, yval)])
clustering <- kmeans(data.matrix, n.points)
if(decide.k) {
  for(k in 3:30) {
    clustering.k <- kmeans(data.matrix, k)
    if(sum(clustering.k$size >= min.points) >
       sum(clustering$size >= min.points)) {
      clustering <- clustering.k
    }
  }
}
Next select the centers of the clusters that meet the minimal size requirements. Furthermore make a data frame and normalize the size, because this is needed for ggplot to make a nice visualization.
  clustering.df <- as.data.frame(clustering$centers
  [clustering$size >= min.points,])
  clustering.df$cluster.size <- clustering$size
  [clustering$size >= min.points]
  clustering.df$cluster.size <- round(clustering.df$cluster.size * 30 /
  max(clustering.df$cluster.size))
Finally visualize the results using ggplot and also include a trend line on the original data points.
  plt <- ggplot(clustering.df,
                aes_string(y=yval, x=xval)) +
    geom_point(shape=16, size=clustering.df$cluster.size, alpha=alpha) +
    geom_smooth(data = plot.data, method=lm) + ggtitle(title)

  return(plt)
Additionally we can test our function using the mtcars dataset.
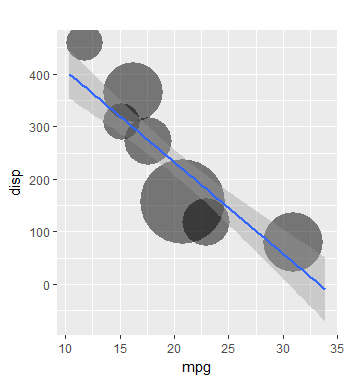
PrivacyPlot(mtcars, "mpg", "disp", min.points = 3,
alpha = 0.5, decide.k = T)
So that this results in a scatterplot showing the trend and where the majority of points can be found. Also, in this example, the plot points represent a minimum of 3 points.